The EO4SD – Fragility Conflict, and Security consortium evaluated an additional advanced analytical technique and data sets to assess locust impacts in Somalia

Data source: a) eLocust3 data, FAO, b) Worldview-3 (2017) ESRI World Imagery.
NEWS
A novel data-mining technique applied to Sentinel-2 time series data in Somalia shows promising results for the detection of impacts of locusts in agricultural fields. This work builds on the consortium’s rapid evaluation of Sentinel-2 data to assess the impacts of the 2020 locust upsurge on croplands in Ethiopia.
Desert Locust upsurge in Somalia
According to the Food and Agriculture Organization of the United Nations (FAO) (FAO 2020), a high density of desert locust swarms was observed in the fall of 2020, in north west Somalia, in the region of Woqooyi. The locust upsurge in the region of Woqooyi coincided with reported below-average crop harvest between October and early December 2020, according to a Desert Locust impact assessment conducted by the Food Security and Nutrition Working Group. During this period, three out of four agricultural fields impacted by locust in Somalia were reported to have high to very high losses, causing impacts such as food insecurity and malnutrition.
 Desert locust impact assessment survey, Food Security and Nutrition Working Group (FAO) b) eLocust3 data, FAO, c) Waterbodies, Natural Earth 2019, d) Administrative boundaries, ESRI.")
Data source: a) Desert locust impact assessment survey, Food Security and Nutrition Working Group (FAO) b) eLocust3 data, FAO, c) Waterbodies, Natural Earth 2019, d) Administrative boundaries, ESRI.
EO time series analysis for locust impact assessment
The FCS consortium evaluated time series of Sentinel-2 data and the Dynamic Time Warping (DTW) analysis technique to detect locust impacts on agricultural croplands in the Woqooyi Galbeed region of Somalia. The objective of the study was to evaluate the use of a time series technique that, when used with robust field training data, could be used to help identify agricultural fields showing anomalous vegetation signatures for targeted locust response and mitigation efforts.
 eLocust3 data, FAO, b) Administrative boundaries, ESRI World Topographic Map. c) Site photo, Google Maps, 2019.")
Data source: a) eLocust3 data, FAO, b) Administrative boundaries, ESRI World Topographic Map. c) Site photo, Google Maps, 2019.
The DTW algorithm was applied to Sentinel-2 imagery to identify agricultural fields exhibiting suppressed Modified Soil-Adjusted Vegetation Index (MSAVI) values that could be indicative of locust impacts. The analysis steps were:
1. Calculate Modified Soil-Adjusted Vegetation Index (MSAVI) Sentinel-2 time series.
MSAVI is a vegetation index that is known to be a robust estimator of leaf area index (LAI) and crop productivity while minimizing the effect of bare soil and accounting for uncertainties resulting from variation in background condition (Qi et al., 1994, Broge and Leblanc, 2000;). MSAVI was computed for all Sentinel-2 images acquired over the study site between 2016 and 2020. 15-day MSAVI composite images were computed to reduce potential impacts from cloud and cloud-shadow.
2. Identify MSAVI anomalies in individual agricultural field.
The FAO eLocust3 data provides field observation on locust presence, abundance, life cycle stage and on soil moisture, vegetation status, habitat type, and treatment control, for all locust affected countries in Africa, Arabia and Asia (Cressman et al., 2016). Sentinel-2 MSAVI composite images were used with eLocust3 data to identify agricultural fields exhibiting anomalous MSAVI values coinciding with the locust upsurge.
Fields exhibiting a suppressed MSAVI profile during the 2020 locust infestation compared to MSAVI values over the previous four years, were identified as potentially impacted by locust and used as reference for the DTW time series analysis. A total of nine (9) reference profiles were compiled in this manner.
 in proximity of eLocust observations")
2016-2020 MSAVI values for agricultural fields (FID 3) in proximity of eLocust observations
3. Use Dynamic Time Warping to assess similarities between unknown agricultural fields and selected reference fields.
Dynamic Time Warping is a time series alignment algorithm that compares the similarity between two temporal sequences by finding their optimal alignment. The DTW approach allows distortions such as time scaling or translation, shape changes, or noise in the data when comparing sequences (L’hermitte et al., 2011), which is desirable for mapping crops with phenological discrepancies caused by different environmental conditions, e.g., varying precipitation patterns, timing of crop planting, and timing of locust impacts.
The DTW algorithm was used to assess similarities between 135 independent agricultural fields distributed across the region and nine reference profiles by calculating and selecting the smallest DTW distance to any of the reference profiles. The figure below shows the DTW distance calculated for all 135 independent agricultural fields, where fields exhibiting small DTW distance (shown in blue cyan) indicate high similarity of the time series profile to the reference profile, and a large DTW distance (shown in purple, pink) indicates a low similarity to the reference profile, suggesting the field is unlikely to present a suppressed vegetation profile. The associated graph shows time series examples for a few agricultural fields with small or large DTW distance.
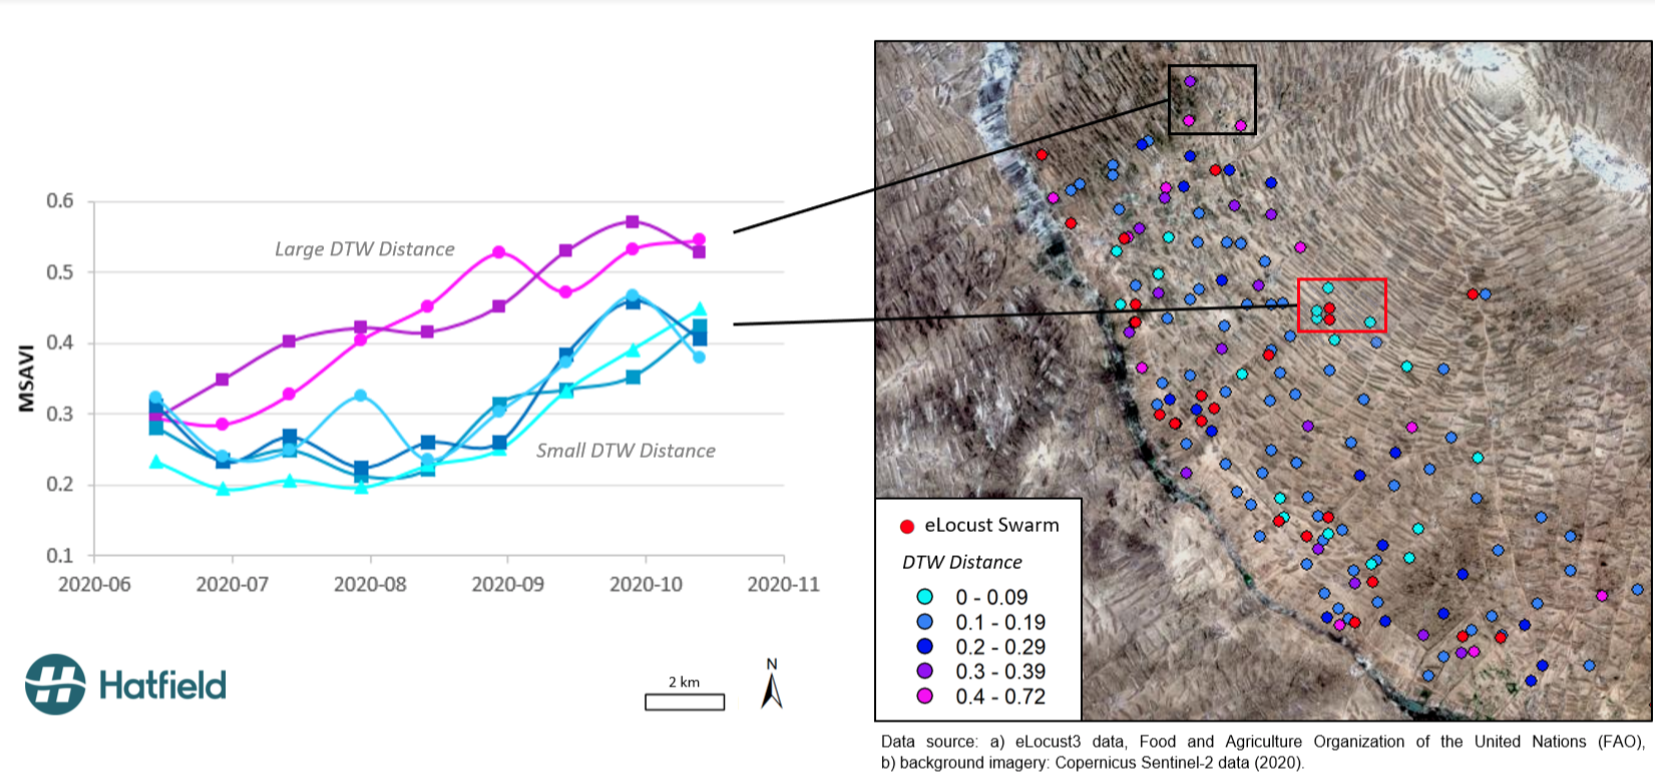
The DTW analysis was also conducted on a per-field basis for the area highlighted by a red rectangle (in the above figure). Continuous DTW distances were binned to several categories, Anomaly for DTW <0.1, Possible Anomaly for DTW between 0.1 - 0.2, and Normal for DTW >0.2. These DTW thresholds were arbitrarily set and could be adjusted based on field data and verification.
 eLocust3 data, Food and Agriculture Organization of the United Nations (FAO), b) Background imagery: Worldview-3 (2017) ESRI World Imagery.")
Data source: a) eLocust3 data, Food and Agriculture Organization of the United Nations (FAO), b) Background imagery: Worldview-3 (2017) ESRI World Imagery.
ConclusionS
The analysis we conducted evaluated the potential of the DTW algorithm applied to Sentinel-2 time series data to detect impacts of the 2020 locust infestation on agricultural croplands in Somalia.
The study demonstrated that the DTW technique is able to identify agricultural fields with similar temporal profiles (e.g., suppressed vegetation) when compared to a set of reference profiles labeled as locust impacted. This suggests that the DTW approach, when used with robust field training data, could be used as a screening tool to help target locust control operations and mitigation efforts. Resulting information could also be used by authorities to support activities such monitoring of food security issues.
References:
- Broge, N. H., and Leblanc, E., 2000, Comparing prediction power and stability of broadband and hyperspectral vegetation indices for estimation of green leaf area index and canopy chlorophyll density. Remote Sensing of Environment. 76, 156 – 172.
- Cressman, K., Van der Elstraeten, A., & Pedrick, C. (2016). eLocust3: An innovative tool for crop pest control.
- FAO 2020, FAO Desert Locust Bulletin – 2 November 2020, Consulted on November 3, 2020. http://www.fao.org/ag/locusts/common/ecg/2564/en/DL505e.pdf
- Qi, J., A. Chehbouni, A. R. Huerte, Y. H. Kerr, and Sorooshian, S., 1994, A modified soil adjusted vegetation index: Remote Sensing Environment, v. 48.119-126.
- L’hermitte, S.; Verbesselt, J.; Verstraeten, W.W.; and Coppin, P. A., 2011, Comparison of Time Series Similarity Measures for Classification and Change Detection of Ecosystem Dynamics. Remote Sensing of Environment. 115, 3129–3152.